A Dive into Prometheus Metrics
Introduction
Metrics play a crucial role in any observability stack. They provide a quantitative understanding of system behaviors, helping in monitoring, alerting, and performance tuning. Streamdal employs the widely-accepted Prometheus format to define and expose these metrics, ensuring ease of integration and a standardized approach to observability.
Understanding the Metrics Format
Prometheus, an open-source systems monitoring and alerting toolkit, uses a specific text-based format for metrics. Let’s take a brief look:
# HELP streamdal_dataqual_failure_trigger Number of events/bytes that triggered a failure rule, for each failure rule type
# TYPE streamdal_dataqual_failure_trigger counter
...
# HELP streamdal_dataqual_rule Message count and bytes by rule set and rule
# TYPE streamdal_dataqual_rule counter
...
# HELP: Describes the metric's purpose.
# TYPE: Indicates the metric type, e.g., counter, gauge, histogram, etc.
Metric Name: Like streamdal_dataqual_rule, uniquely identifies a metric.
Labels: Enclosed in {}, provide additional dimensions to the metric, e.g., rule_id, ruleset_id, type, etc.
Why This Format?
Self-descriptive: Each metric comes with its descriptor, making it easier for developers and systems to understand its purpose and significance.
High Granularity with Labels: Labels provide multi-dimensional data, allowing for more refined querying, filtering, and aggregation. This is especially important in Streamdal, where understanding metrics in the context of specific rules or rulesets is vital.
Standardization: Using a recognized format ensures easy integration with monitoring systems like Prometheus and visualization tools like Grafana.
Benefits of Having These Metrics in Streamdal Rules Insights: By observing metrics like streamdal_dataqual_rule, we can infer the throughput of specific rules – both in terms of message counts and bytes processed. This helps in identifying high-traffic rules and any potential bottlenecks.
Failure Triggers: Metrics like streamdal_dataqual_failure_trigger provide invaluable insights into rules that frequently trigger failures. This could help in refining rules or addressing data quality issues.
Performance Monitoring: Observing the message counts and bytes processed over time can provide insights into system performance and resource utilization.
Operational Awareness: Knowing how rules are executed and the associated metrics ensures that operations teams are equipped to handle any spikes in data, system anomalies, or potential outages.
Trend Analysis: Over time, observing these metrics can provide trends, helping in capacity planning, rules optimization, and understanding data flow patterns.
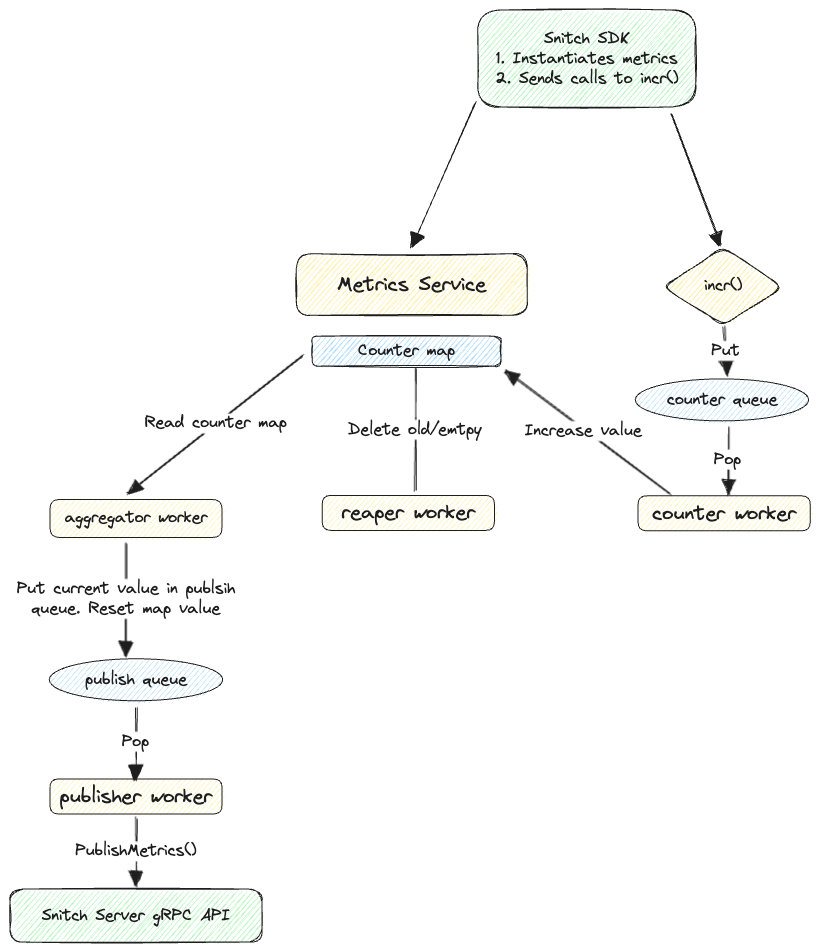
Diagram of metrics flow

Conclusion
The Prometheus metrics format is more than just a structured way of representing data. It’s a gateway to understanding the behaviors, performance, and health of Streamdal. By integrating this standardized metrics format, Streamdal ensures consistent observability, actionable insights, and enhanced operational excellence.